
2026 Water Report
Now in its 15th year, our annual survey of public agencies and utilities across the U.S. measures progress attacking issues, tracks market shifts and spotlights the emerging challenges and opportunities shaping the future of water.
Facing challenges as deeply rooted as they are familiar, U.S. water sector utilities are responding with focus, proactivity and innovation to manage risk and advance sustainable, resilient solutions.
Respondents to this year’s survey of more than 600 U.S. water sector stakeholders for the Black & Veatch 2026 Water Report point to an old refrain: insufficient capacity, outdated systems and facilities that must stay in operation at or beyond their planned lifecycles. Aging infrastructure again tops the list of challenges (Figure 1).
Funding and available capital remain constrained, restricting ambition to satisfy the needed scale of upgrades. Retirements across engineering, operations and technical roles carry capital delivery and technical capacity risks, prompting more utilities to seek outside help. More than half of respondents — 55% — report outsourcing engineering and technical staff.
Add to that the ever-rising demand for reliable, affordable and safe water service, uncertain regulatory expectations and the need for extensive hazard mitigation planning to address increasingly expensive impacts from changing climate patterns. Industrial demand, led by data centers and advanced manufacturing, is at a scale nonexistent a decade ago, straining some water systems.
Utilities know the complexities they face. This year’s survey results show steady momentum in adapting how they plan, deliver and collaborate to keep pace with mounting challenges.

Water utilities are making long-term treatment decisions inside an uncertain regulatory environment, and PFAS — per- and polyfluoroalkyl substances (PFAS), commonly known as “forever chemicals” — is an example. Financial capacity has overtaken regulatory uncertainty as the top barrier among utilities addressing PFAS, with 31% of respondents citing budget and ratepayer constraints as the greatest limiting factor. Only 24% are confident in meeting regulatory obligations without substantial rate increases.
Regulation remains the dominant force shaping capital plans — 61% say regulatory changes are driving capital planning significantly or moderately — and most have responded by reallocating funds, slowing capital improvement program (CIP) projects or setting aside contingency.
Operationally, two-thirds of respondents point to treatment upgrades as the top challenge, compounded by generational workforce turnover reshaping skill sets and training needs.
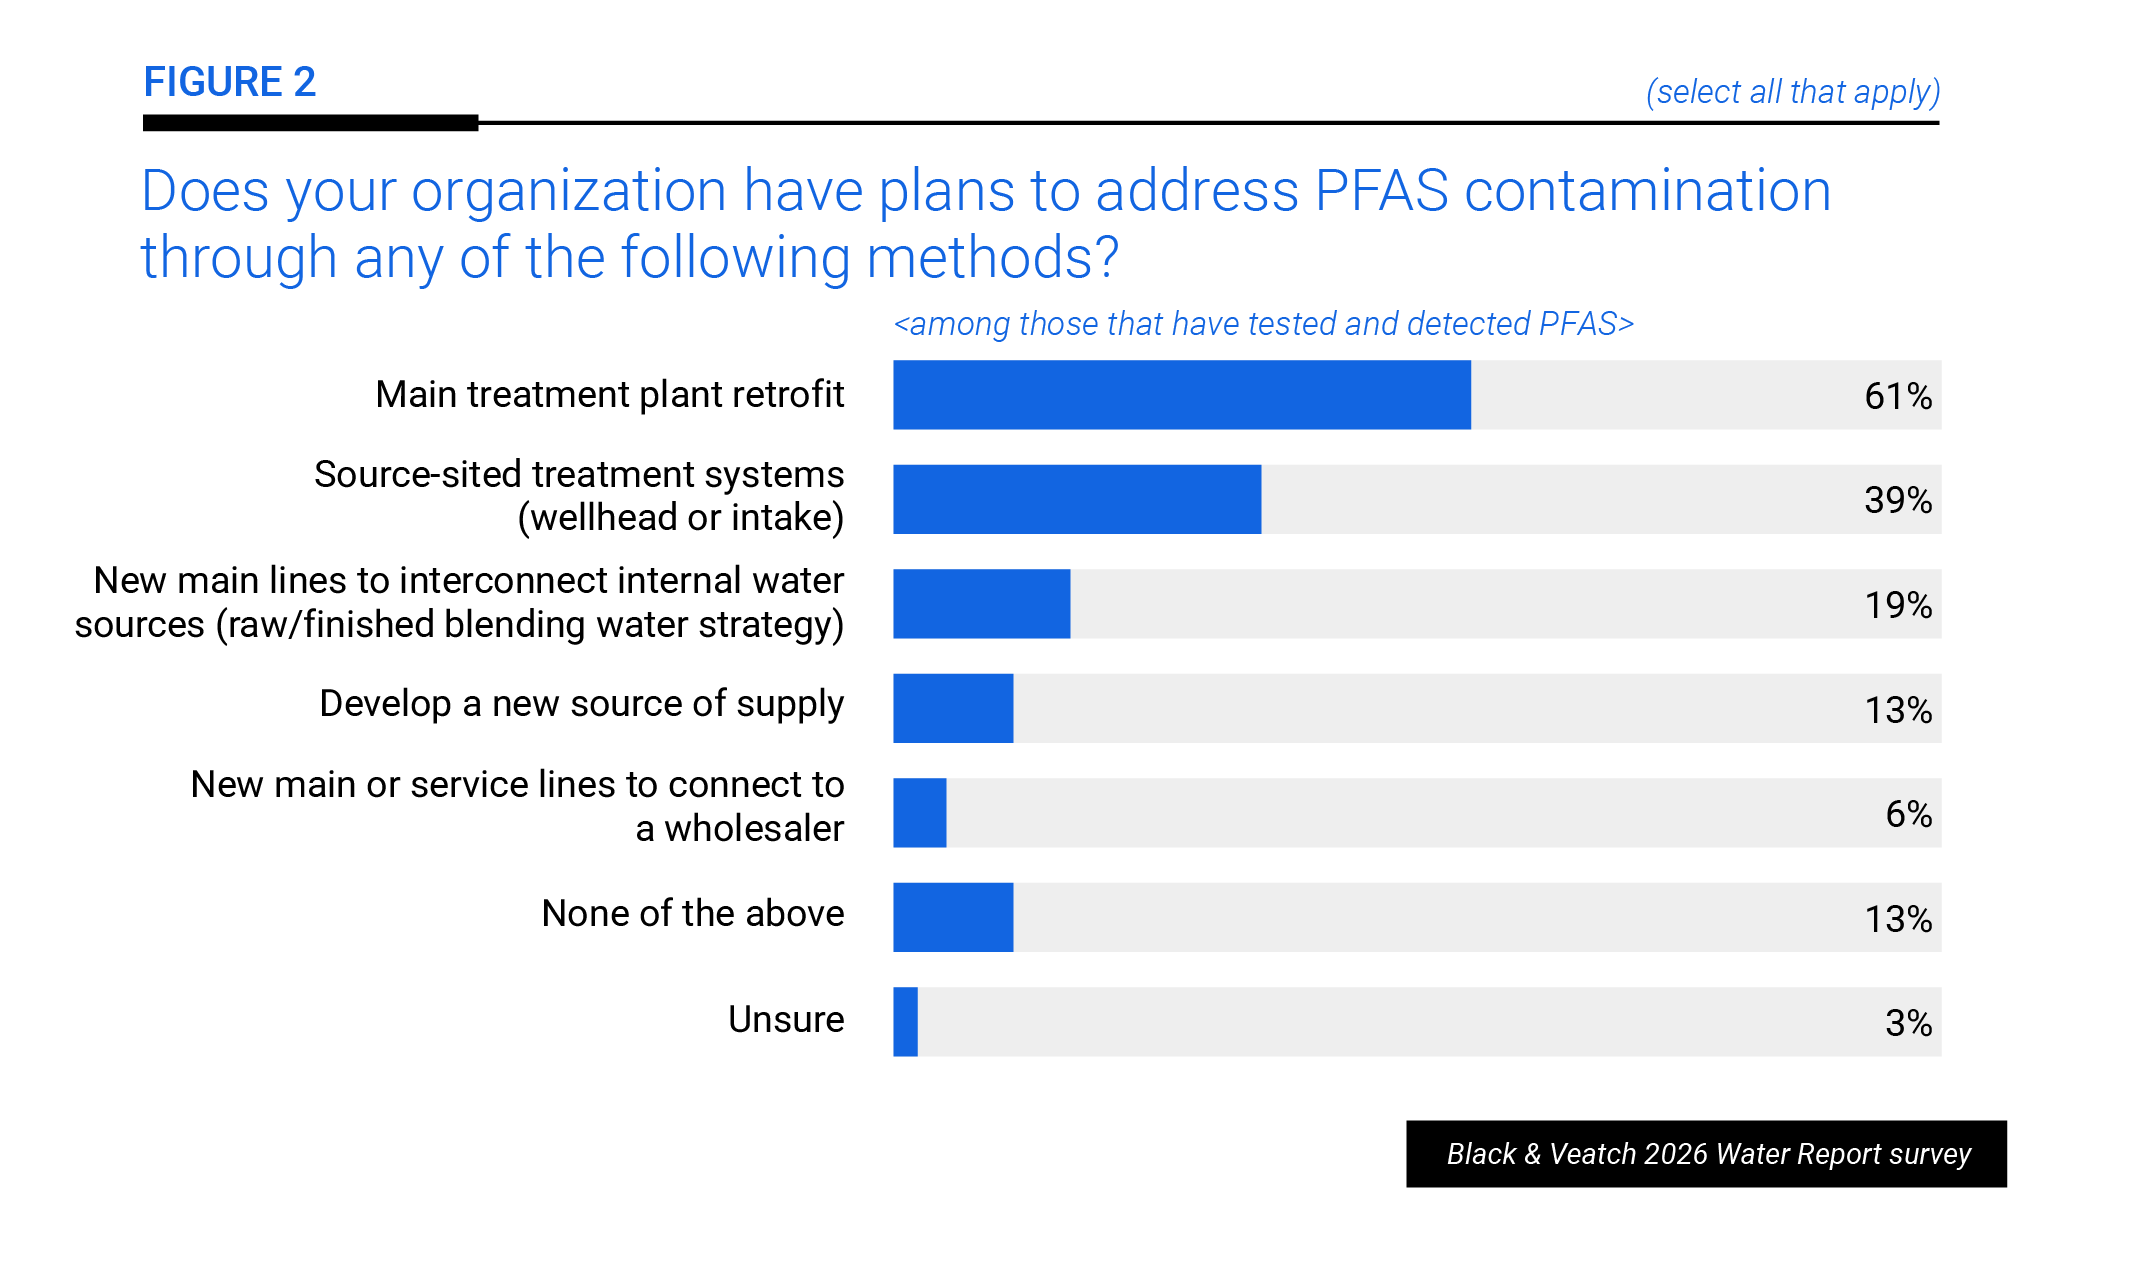
The solutions being leveraged to such water quality challenges, needs and goals show strategic thinking. Despite regulatory uncertainty, 35% of drinking water respondents are planning or implementing PFAS treatment, and among those with plans, 61% are pursuing main treatment plant retrofits (Figure 2).
The proactivity extends across the treatment spectrum: 80% of wastewater respondents report testing influent, effluent or biosolids for PFAS. Utilities are holding back on microplastics, an emerging contaminant quickly garnering attention. They’re preserving capital for more near-term and clearer compliance mandates.
The bottom line: Utilities are tackling risks directly, investing and innovating where the return is clearest, balancing compliance, sustainability, resilience and practicality.

Supply resilience is being tested on multiple fronts. Eighty-six percent of respondents say they’re very or somewhat confident in their water supply resiliency. Climate-driven water stress is forcing utilities to revisit long-range supply plans at a faster pace, and rising industrial demand — primarily by data centers and manufacturing — is compounding pressure. The share of respondents who say they can provide both water supply and system capacity to a large incoming industry has dropped from 73% in 2024 to 60% in 2026, notable for an industry accustomed to planning on 20- to 30-year horizons.
Utilities are protecting and bolstering their supplies in ways shaped by local conditions, regulatory drivers and available resources. Conservation remains the most common resiliency action (Figure 3).
Water reuse adoption is expanding unevenly, with non-potable reuse advancing fastest — now a strategy for 49% of respondents — while potable reuse remains more limited at 35% for indirect and 14% for direct. Thirty-eight percent expect to add reuse technologies within the next decade (mostly within five years), with regulatory clarity and funding seen as the key accelerators. Meanwhile, industrial users are moving faster, with 62% pursuing expanded reclaimed or non-potable supplies and 72% factoring industrial water needs into planning. Only 18% of utilities have developed an integrated or One Water plan, though another 18% see a need to do so.

Water security spans digital and physical systems, from cyber protection and data-driven decisions to reliable conveyance and storage. Legacy systems persist despite modernization efforts, and physical vulnerabilities remain acute: Just 24% of utilities have full transmission redundancy, 47% meet storage targets, and conveyance shortfalls are emerging as an economic constraint. While 59% have digital strategies and 70% collect enough data, only 19% leverage it effectively (Figure 4).
The next step for utilities: closing the gap between data collection and insight. Utilities that treat digital maturity as an afterthought risk weakening their ability to manage performance, cost and risk in concert. Where execution is strong, results are tangible and clear: Decision security is foundational to system-wide assurance.

Resilience plans are rapidly moving from documentation to execution. This year’s data show a sharp increase in active disaster response, recovery and resilience plans, with utilities translating vulnerability studies into infrastructure hardening, security upgrades and workforce development.
Sustainability has become a strategic priority for 79% of respondents (up from 58% last year), and confidence is rising: 60% believe goals are achievable within 10 years.
Delivery models are evolving. Use of alternative delivery has tripled from 196 in early 2024 to 587 in late 2025, with investment rising from $19.4 billion to $47.4 billion across 43 states. Progressive design-build leads the way for earlier risk visibility and stronger cost and schedule certainty. More than half of respondents expect to increase their use of collaborative delivery during the next three years.
Asset management and operational efficiency now anchor sustainability efforts, directly linking performance, resilience and long-term stewardship. Utilities are focusing implementation on new water supply development, reuse expansion and green stormwater infrastructure — strategies that strengthen resilience while advancing measurable sustainability commitments.
Planning, executing and optimizing resilience is the primary driver that connects every investment discussed in this year’s survey.
